22 Mar 2023
USD Index Price Analysis: A deeper pullback looks likely below 103.00
- DXY looks offered and revisits the 103.00 region pre-Fed.
- The loss of 103.00 could spark a deeper correction near term.
DXY extends the weekly leg lower and retests the 103.00 neighbourhood, where some decent contention appears to have emerged so far.
The bearish mood appears unabated for the time being. Against that, there is a minor support at the weekly low at 102.58 (February 14), while the loss of this region could spark further losses to the 2023 low near 101.80 (February 2).
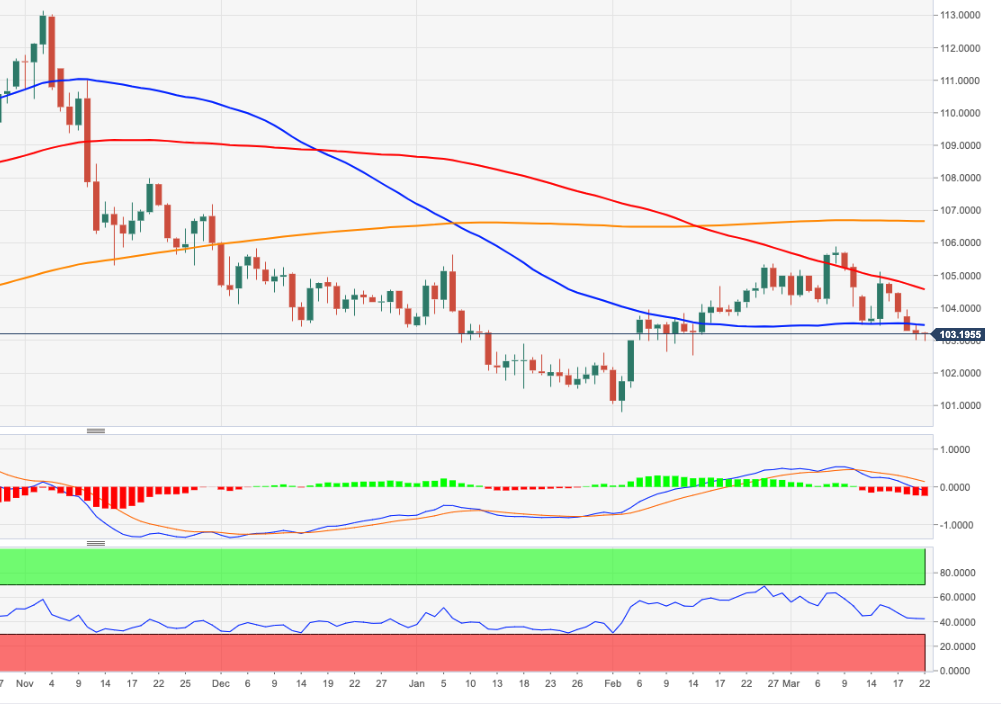
Looking at the broader picture, while below the 200-day SMA, today at 106.61, the outlook for the index is expected to remain negative.
DXY daily chart