WTI Price Analysis: Consolidates above key EMAs near $75 mark
- WTI crude oil holds positive ground above the $74.70 mark.
- Crude oil holds above the key 50- and 100-hour Exponential Moving Averages (EMA).
- The Relative Strength Index (RSI) stands above 70, indicating overbought conditions.
WTI, the US crude oil benchmark, holds the ground above the $74.70 mark during the Asian trading session.
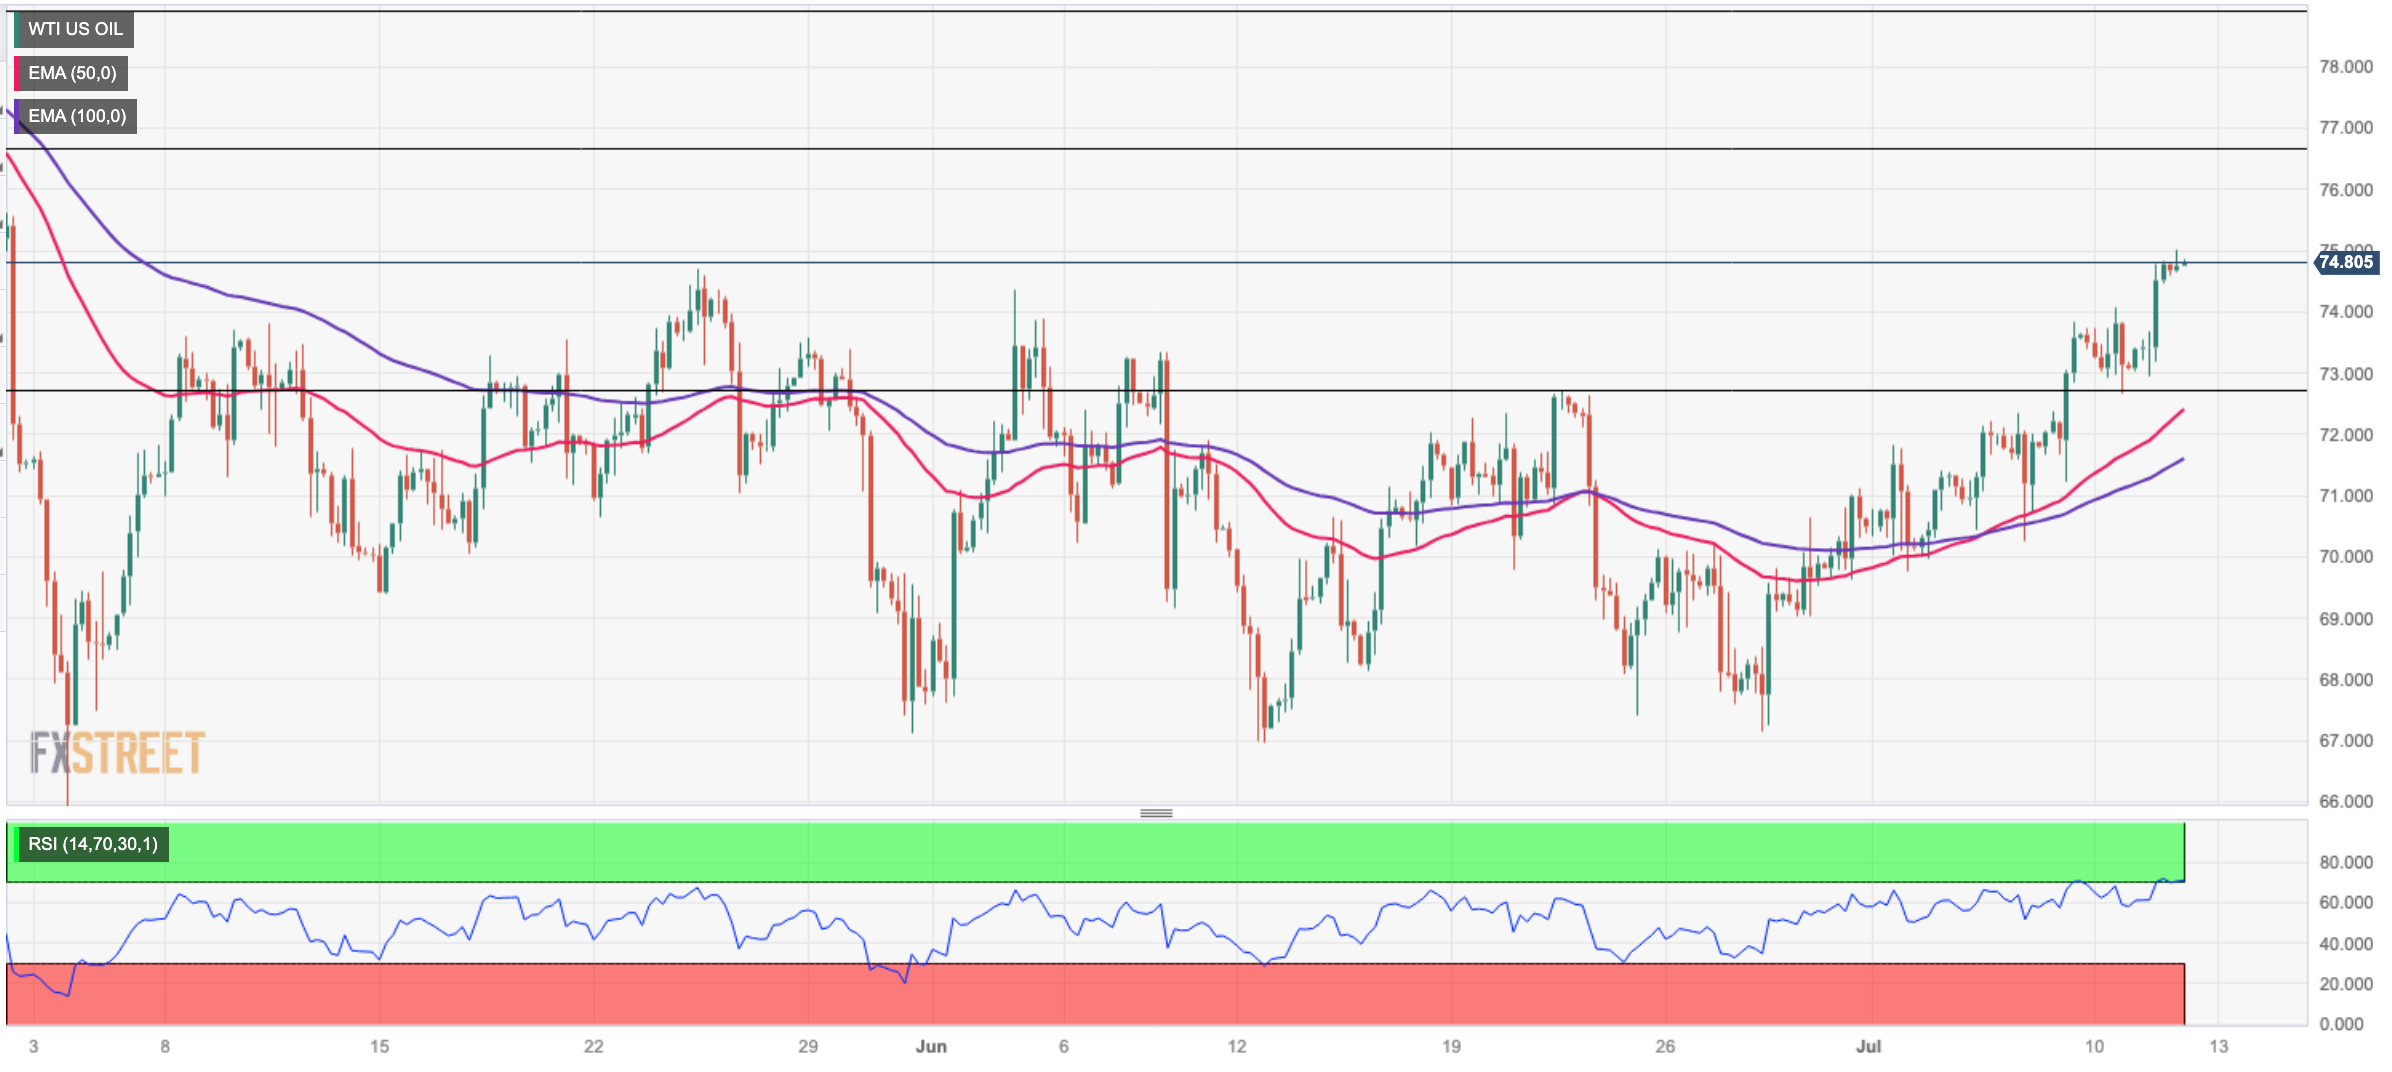
Looking at the four-hour chart, WTI crude oil holds above the key 50- and 100-hour Exponential Moving Averages (EMA) with a rising slope, emphasizing the path of least resistance to the upside.
That said, WTI crude oil will meet the immediate resistance level at $76.65 (a high of April 28) on further upside, followed by $79.25 (a high of April 25). The next barrier is seen at the $80.00 area, representing the psychological round mark.
On the contrary, WTI crude oil could correct toward $72.65 (a low of July 10). A breach of the latter could pave the way for a test of $72.40, highlighting the 50-hour EMA, en route $71.60, the 100-hour EMA.
It is also important to note that the Relative Strength Index (RSI) stands above 70, indicating the overbought condition. Hence, a phase of consolidation or a correction cannot be ruled out from the current price level.
WTI crude oil four-hour chart