13 Sep 2018
EUR/USD Technical Analysis: Breakout seen on 4H chart could embolden the bulls
- The descending channel breakout seen in the ER/USD 4-hour chart indicates a revival of the rally from the August 15 low of 1.1301 and could yield a stronger rally toward the recent high of 1.1733.
- The renewed hopes of US-China trade talks could keep the risky assets and that could only add to the bullish tone around the common currency.
4-hour Chart
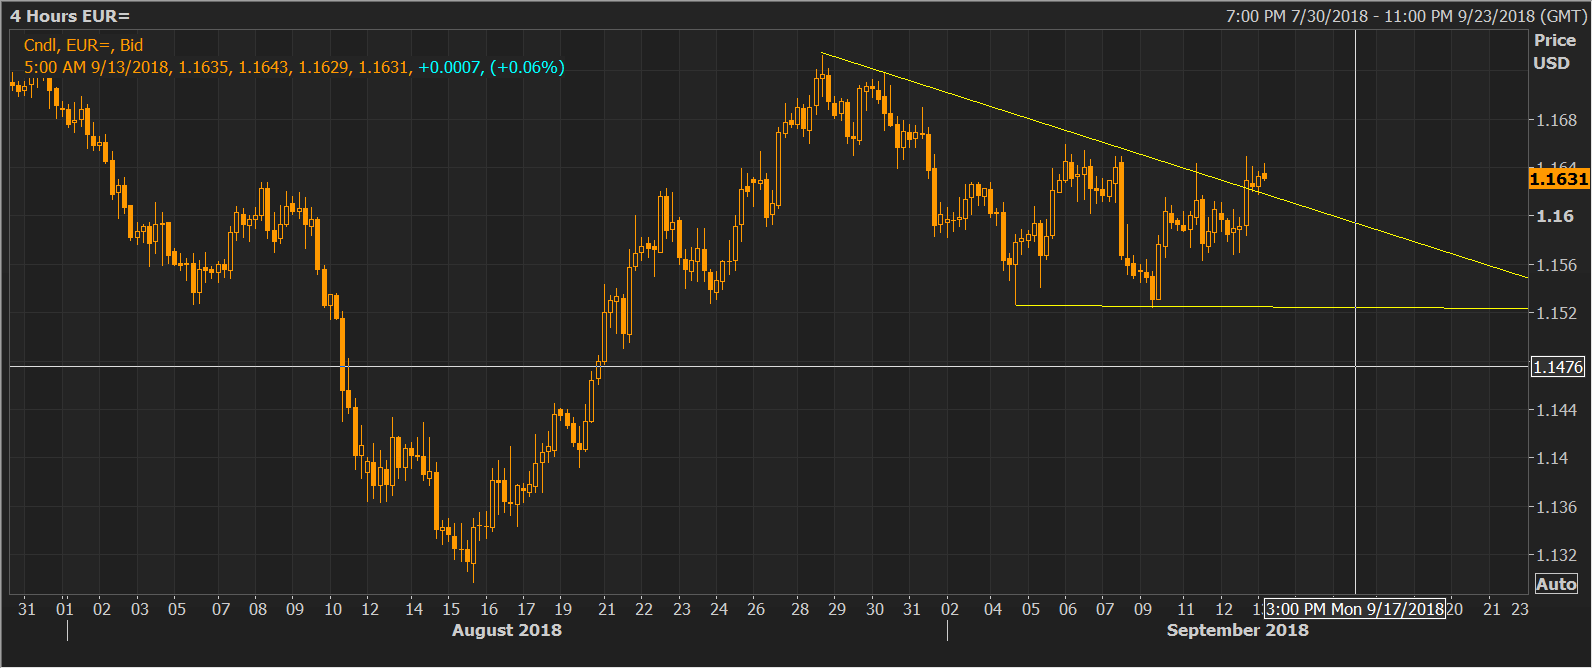
Spot Rate: 1.1636
Daily High: 1.1643
Daily Low: 1.1625
Trend: Bullish
Resistance
R1: 1.1659 (resistance as per the 4-hour chart)
R2: 1.17 (psychological level)
R3: 1.1713 (recent high)
Support
S1: 1.1565 (higher low support on the 4-hour chart)
S2: 1.1526 (Sep. 9 low)
S3: 1.15 (psychological level)