13 Aug 2019
US Dollar Index technical analysis: DXY rising to its highest in six days as US-China trade tensions ease
- DXY (US Dollar Index) is about to close at 5-day highs above the 97.55 mark.
- A daily close above 97.80 would be seen as bullish with the next target at 98.10.
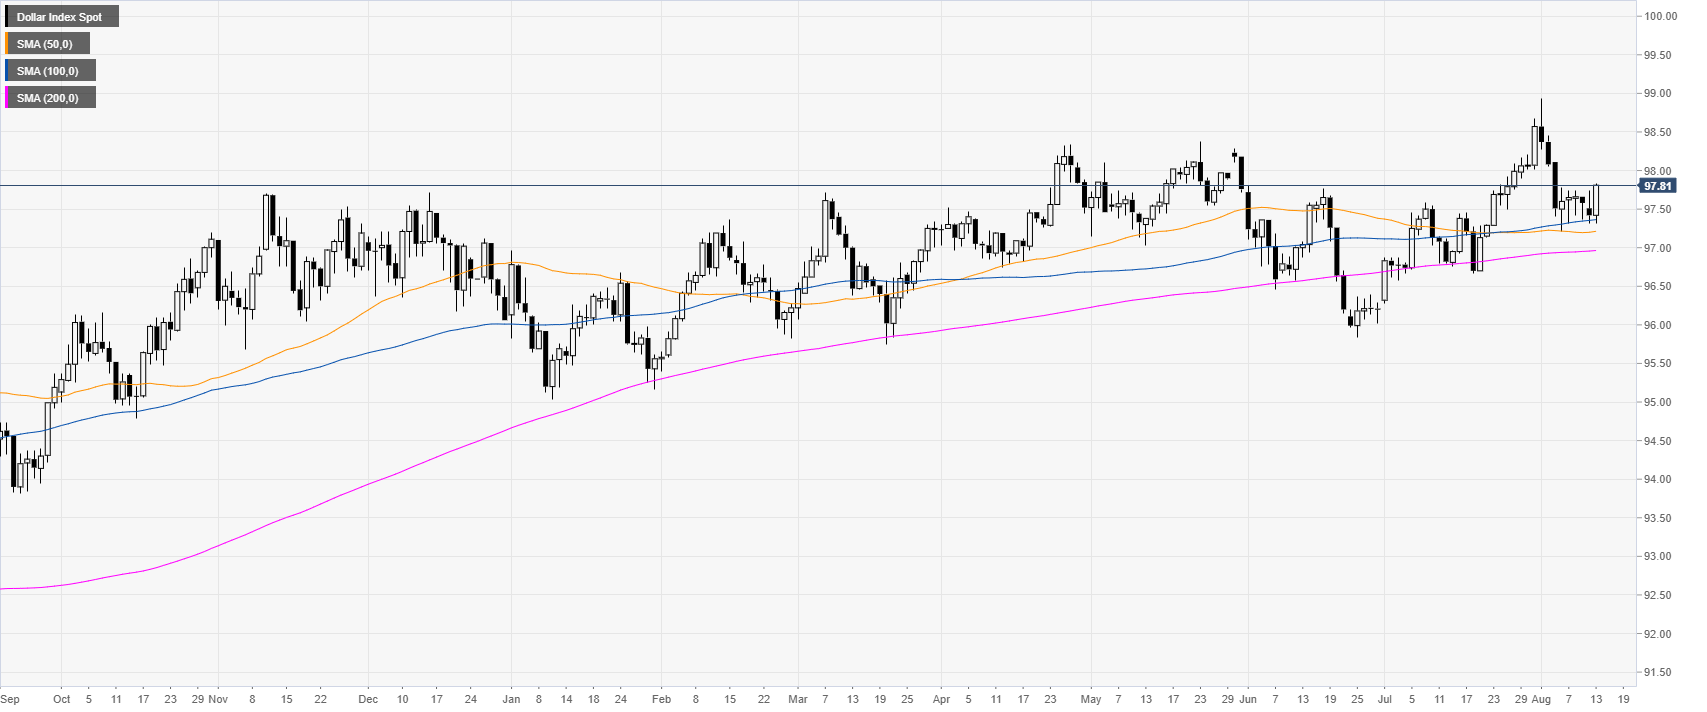
DXY daily chart
DXY (US Dollar Index) is trading in a bull trend above its main daily simple moving averages (DSMAs). Earlier on Tuesday, the US Core Consumer Price Index (YoY) came in better-than-expected at 2.2% vs. 2.1% forecast by analysts, but the market had only a limited reaction to the data. However, DXY rose sharply after the US announced it would delay some of the planned tariffs to December 15.
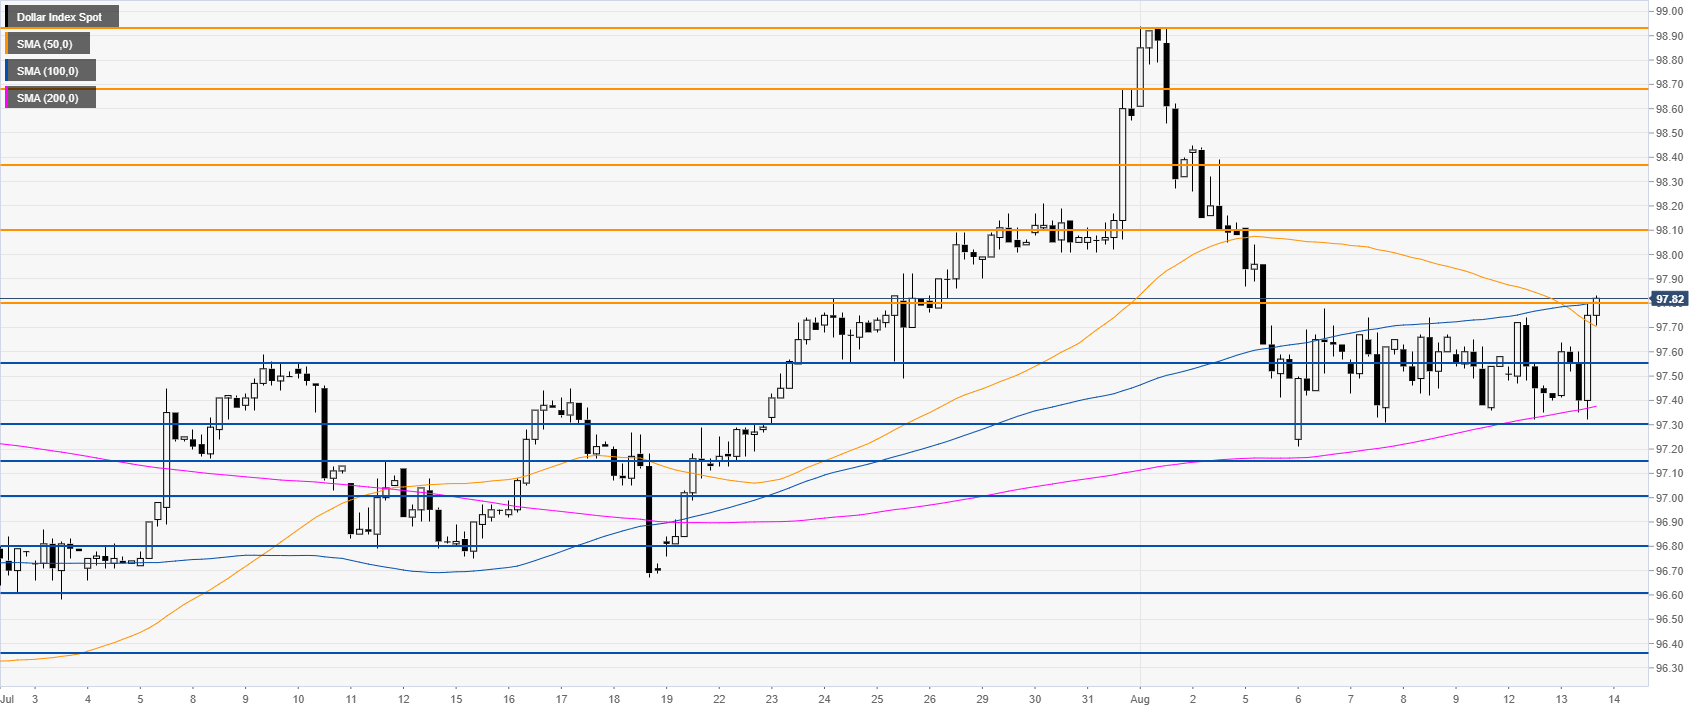
DXY 4-hour chart
The market is challenging the 100 SMA while above the 50/200 SMA. A daily close above 97.80 would be seen as bullish for DXY. Bulls can drive the market towards 98.10, 98.38, 98.68 and all the way to 98.93.
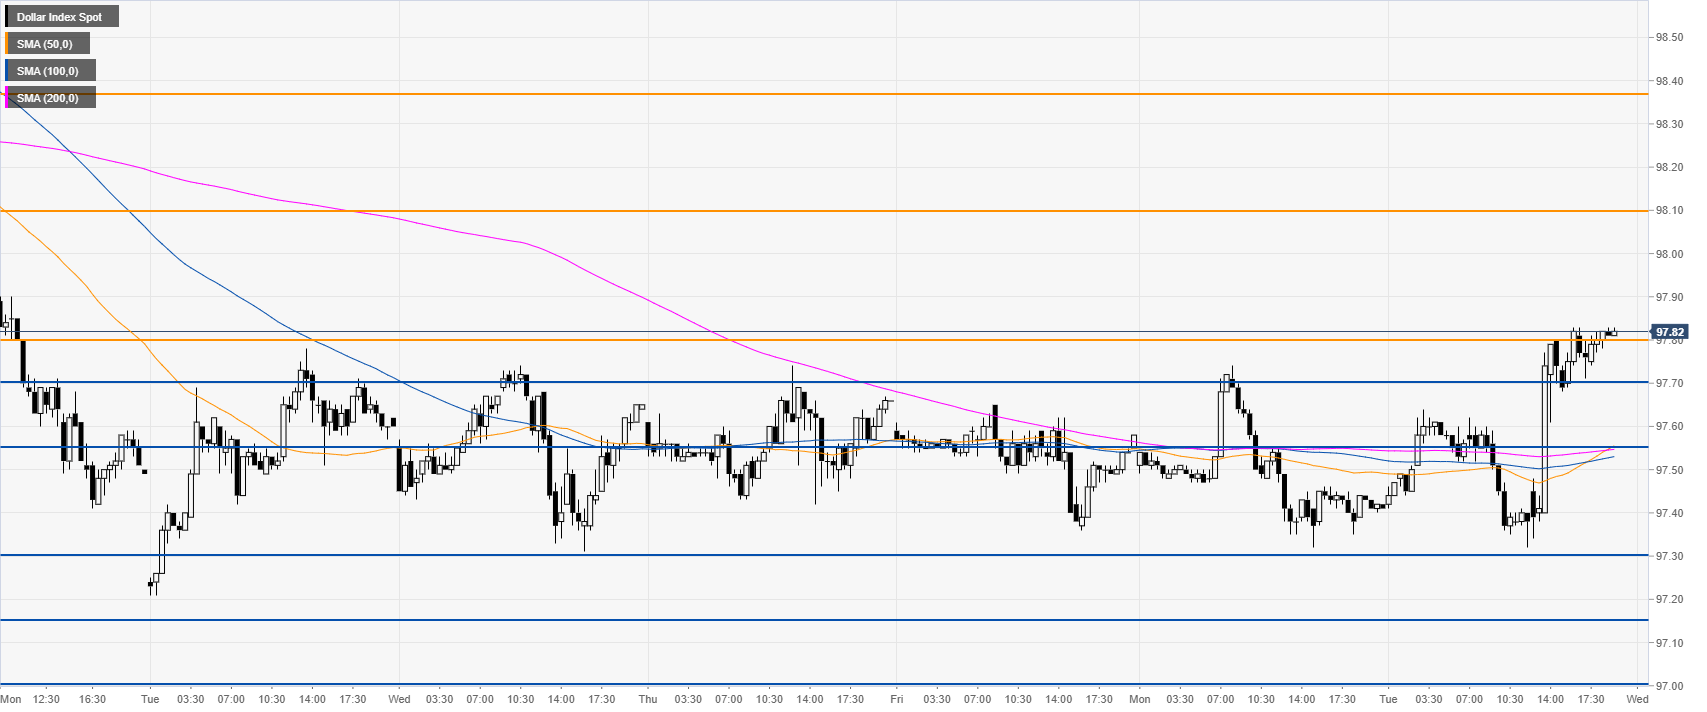
DXY 30-minute chart
The bullish pressure is keeping the greenback to daily highs. Immediate support could be found near 97.70 and 97.55.
Additional key levels