16 Dec 2019
US Dollar Index Price Analysis: DXY vulnerable to the downside near five-month lows
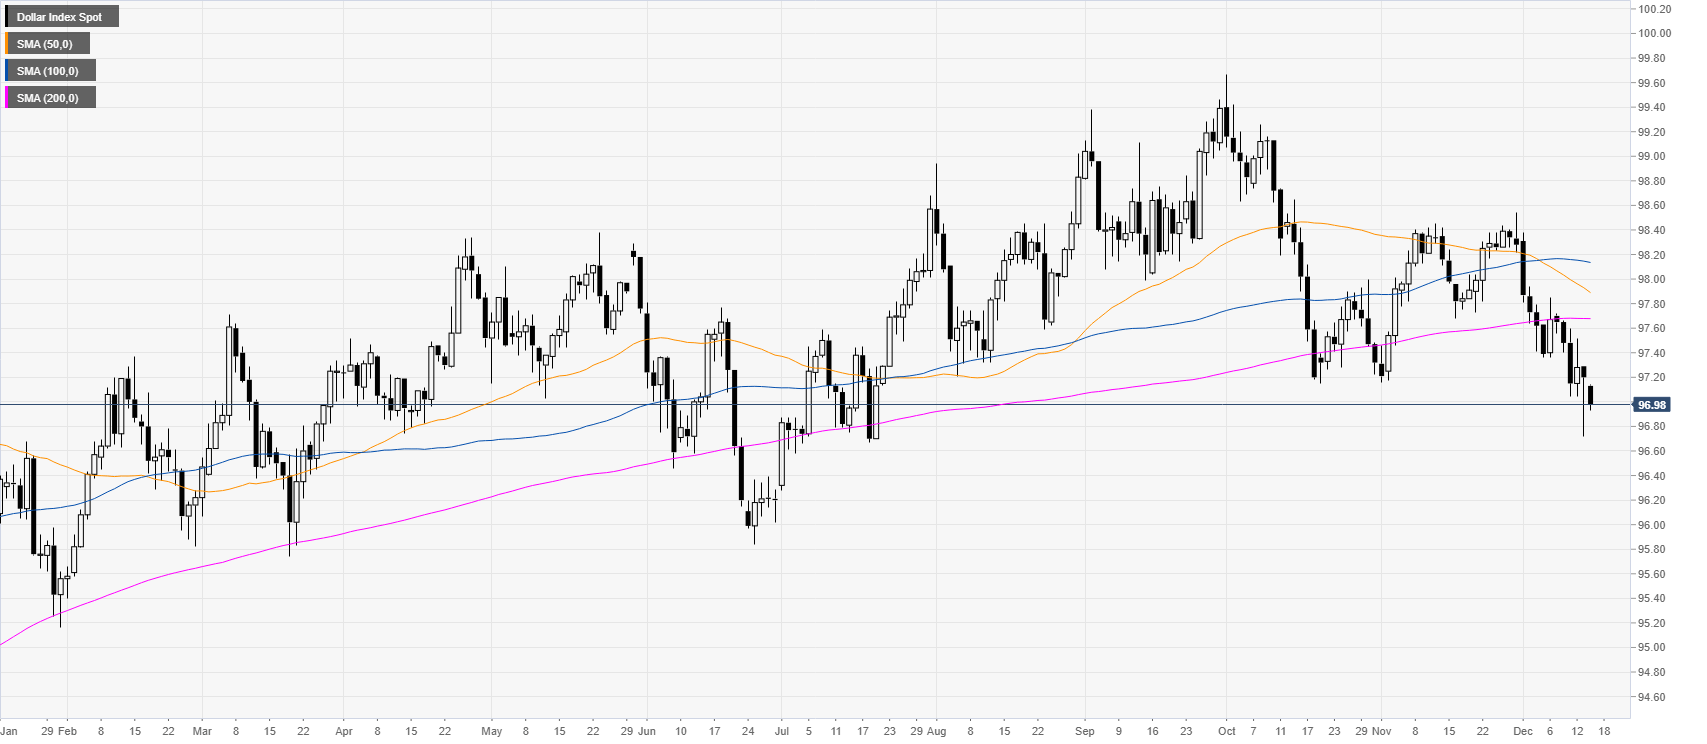
- DXY is starting the week on the back foot trading under the 200 DMA.
- The level to beat for bears is the 97.00 handle.
DXY daily chart
DXY (US Dollar Index) remains fragile while below the 200-day simple moving average (DMA) as the market is under pressure near five-month lows.
DXY four-hour chart
DXY remains under selling pressure below the 97.25 resistance and the main SMAs. The market is challenging the 97.00 support. However, there is little chance bulls will be motivated to actively commit here as the overall context is turning increasingly bearish. Further down lie the 96.70, 97.50 and 97.25 price levels. On the flip side, resistances are seen near the 97.25, 97.55 and 97.85 levels.
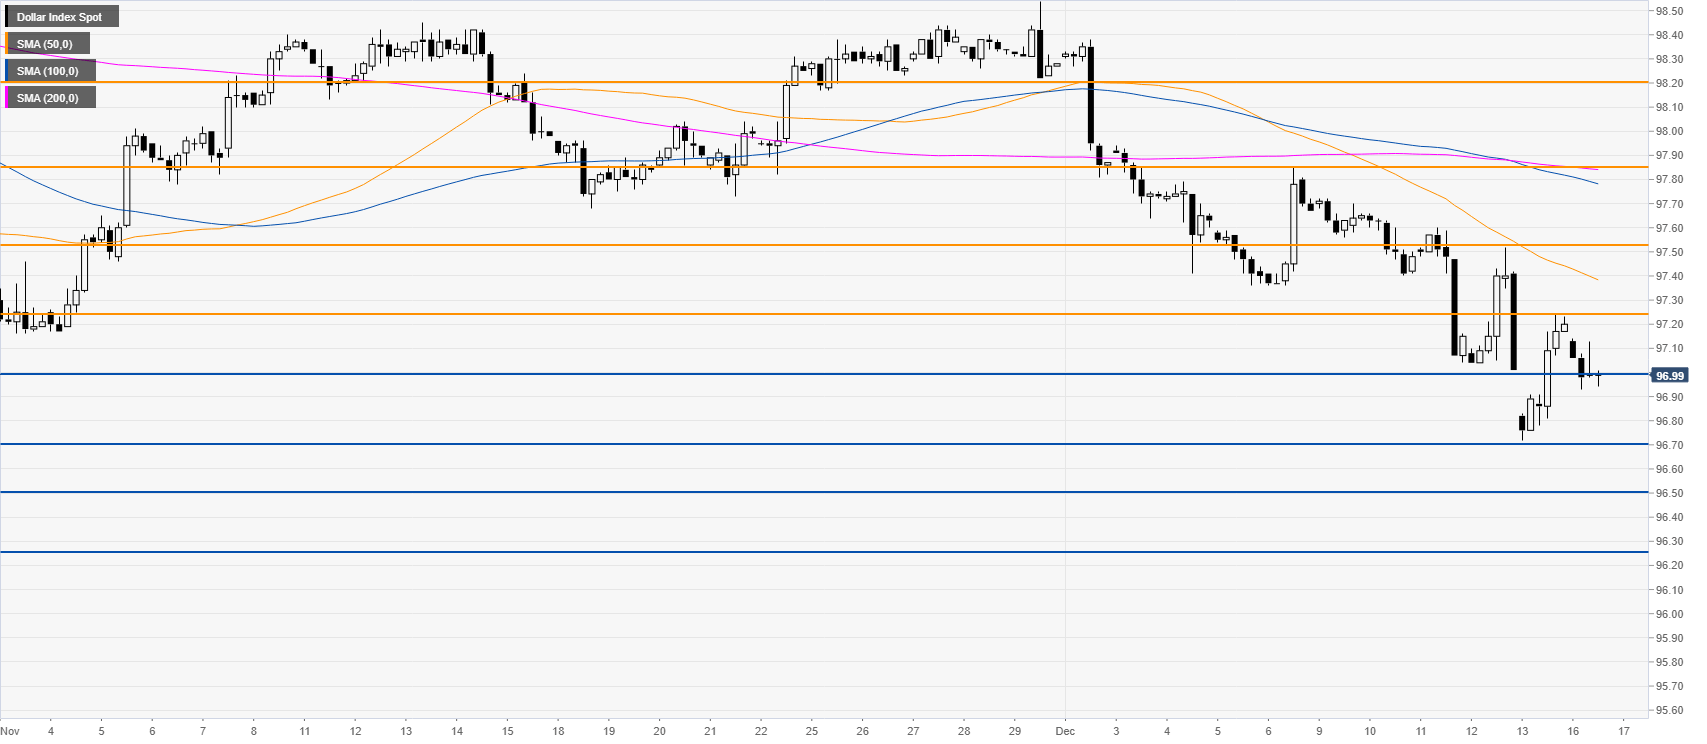
Additional key level