GBP/CAD Price Analysis: Rallies towards 1.7200 amid a falling channel breakout
- GBP/CAD dived out of a falling channel on the hourly chart.
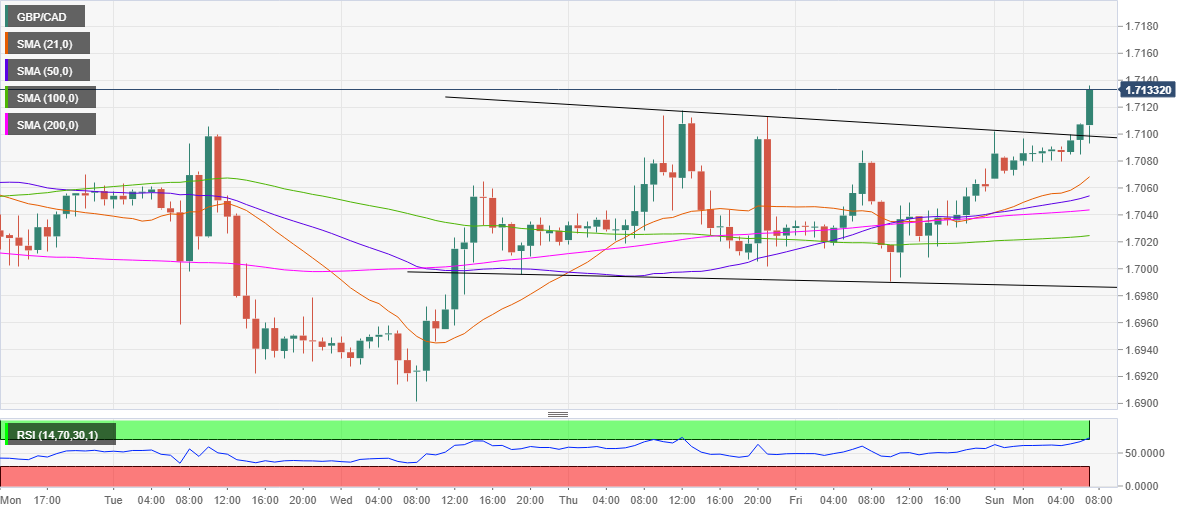
- Hourly RSI probes the overbought territory.
- The spot trades above all major HMAs.
GBP/CAD broke the overnight consolidative mode to the upside in early Europe, diving out of the falling channel formation carved out on the hourly chart.
The bullish breakout appeared after the price closed the hour above the falling trendline support at 1.7099.
The golden cross, with the 50-hourly Simple Moving Average (HMA) having pierced the 21-HMA from below also adds credence to the move higher.
The bulls aim for the pattern target at 1.7226 before which the 1.7200 barrier will be tested. The hourly Relative Strength Index (RSI) teases the overbought conditions, suggesting that there is more room to the upside.
Any pullbacks will meet demand at the trendline resistance now support at 1.7099, below which the bullish 21-HMA at 1.7068 will likely challenge the bears’ commitment.
To conclude, the path of least resistance is to the upside, as the spot trades above all the major hourly averages.
GBP/CAD: Hourly chart