28 Sep 2020
US Dollar Index Price Analysis: Rally falters at the resistance line near 94.70
- DXY’s upside momentum struggles near 94.70 on Monday.
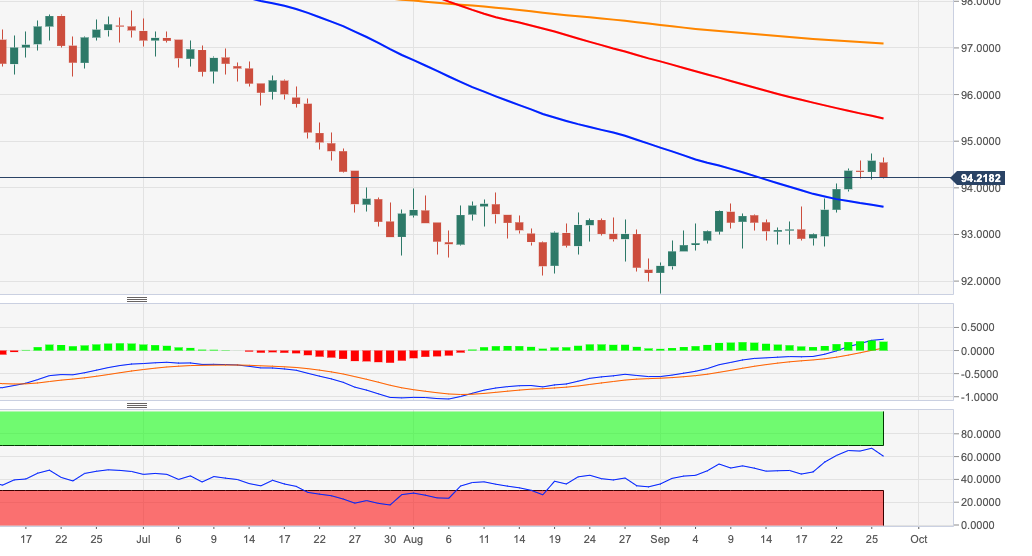
- Interim support emerges at the Fibo level at 94.20.
DXY is eroding part of the recent gains and recedes to the initial support around 94.20 on Monday, where is located a Fibo level (of the 2017-2018 drop).
If sellers keep pushing then there is a minor support at the 55-day SMA, today at 93.59. Further south emerges the 92.75/70 band, where converge the September 10/21 lows).
In spite of the current bounce, the bearish view on DXY is seen unchanged while below the 200-day SMA, today at 97.09.
DXY daily chart