USD/CAD Price Analysis: Seven-week-old support line limits further downside below 1.3150
- USD/CAD fails to extend the bounce off one-week low beyond 1.3132.
- Absence of extreme RSI conditions, sustained trading below key Fibonacci levels, SMA favor the bears.
- 50% Fibonacci retracement adds strength to the 1.3200/3210 key resistance.
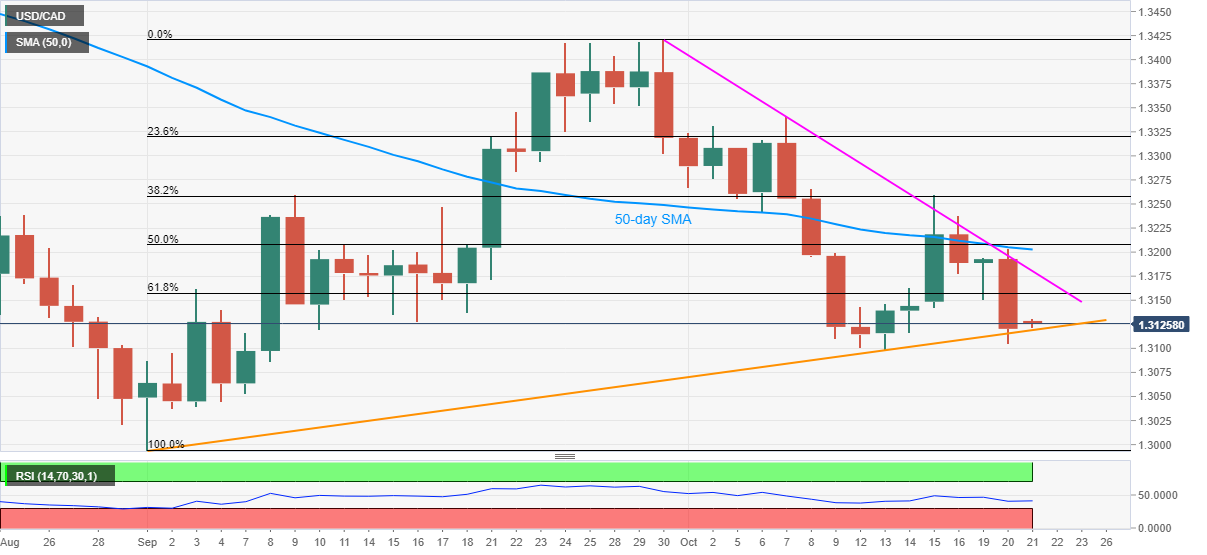
USD/CAD fades pullback from the weekly low while declining to 1.3120 during the early Asian session on Wednesday. The pair marked the biggest losses in eight days the previous day but couldn’t close below an ascending trend line from September 01.
Although normal RSI conditions and sustained trading below the 61.8% Fibonacci retracement of the last month’s upside favor USD/CAD sellers, a clear downside break of the mentioned support line, at 1.3115 now, becomes necessary to confirm the bears’ entries.
It should be noted that the monthly low of 1.3100 and the multiple stops around 1.3050/45 can offer intermediate halts during the pair’s downside from 1.3115 towards the previous month’s low of 1.2994.
Meanwhile, an upside clearance of 61.8% Fibonacci retracement level near 1.3160 needs to break a falling trend line from September 30, at 1.3180 now, before confronting the crucial resistance confluence near 1.3200/3210 that includes 50-day SMA and 50% Fibonacci retracement.
If at all the bulls manage to cross the 1.3210 hurdle, 1.3260 and the monthly high of 1.3340 will gain market attention.
USD/CAD daily chart
Trend: Pullback expected